在制作上位机的时候,很多时候需要使用到监控绘图界面,使用来绘制曲线的组件有很多,GDI+、char、OxyPlot等等,这篇文章用来介绍OxyPlot组件的基本应用,在本文中主要是利用随机数生成函数结合拖杆控件来模拟出绘图所需要的数据。
首先需要先创建一个Winfrom窗体应用的工程,创建工程过程可参考以下链接https://www.cnblogs.com/xionglaichuangyichuang/p/13734179.html
OxyPlot组件是一个开源的组件,需要使用它就需要在工程中安装好给组件,便可以进行后续操作,该组件的安装过程可以参考以下链接完成安装,https://www.cnblogs.com/xionglaichuangyichuang/p/13734265.html
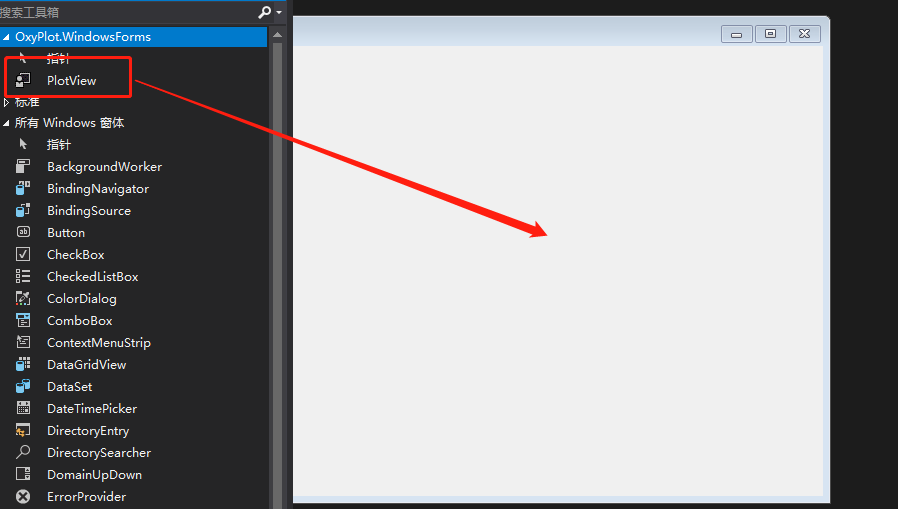
组件安装好之后,打开工具箱,我们可以发现工具箱上多了一组控件,如下图所示,将该控件往右边拖拽既可以完成初步的控件布局。
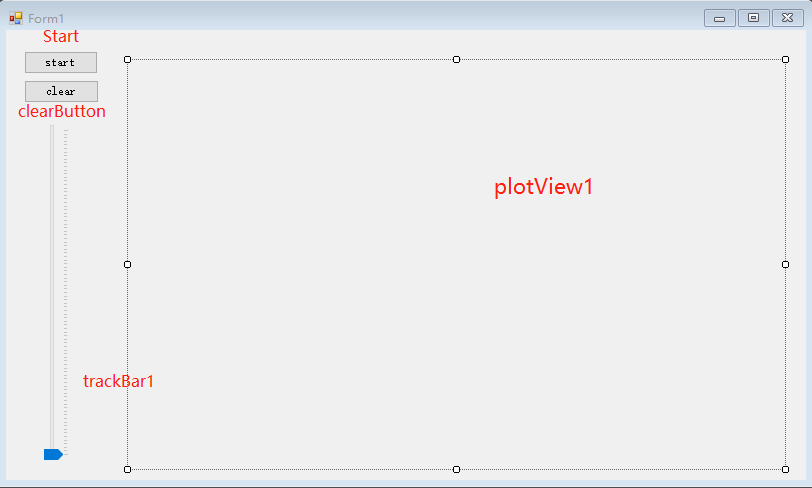
上位机的界面的控件命名如下图:
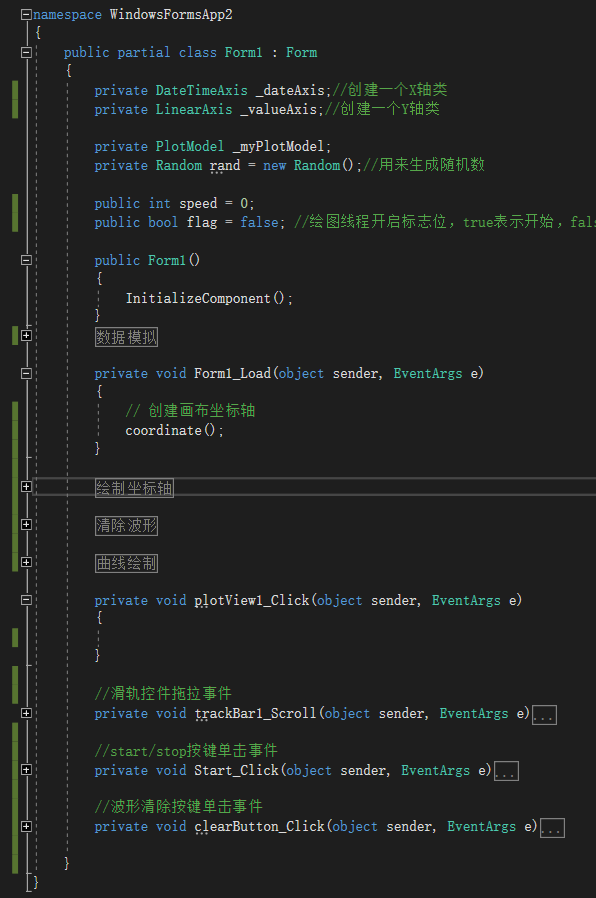
老套路,先抛出完整的工程代码,再对关键部分代码进行解析,完整的工程代码如下图所示:


  1 using System;
  2 using System.Collections.Generic;
  3 using System.ComponentModel;
  4 using System.Data;
  5 using System.Drawing;
  6 using System.Linq;
  7 using System.Text;
  8 using System.Threading;
  9 using System.Threading.Tasks;
 10 using System.Windows.Forms;
 11 using OxyPlot;
 12 using OxyPlot.Annotations;
 13 using OxyPlot.Axes;
 14 using OxyPlot.Series;
 15
 16 namespace WindowsFormsApp2
 17 {
 18     public partial class Form1 : Form
 19     {
 20         private DateTimeAxis _dateAxis;//创建一个X轴类
 21         private LinearAxis _valueAxis;//创建一个Y轴类
 22
 23         private PlotModel _myPlotModel;
 24         private Random rand = new Random();//用来生成随机数
 25
 26         public int speed = 0;
 27         public bool flag = false; //绘图线程开启标志位,true表示开始,false表示停止
 28
 29         public Form1()
 30         {
 31             InitializeComponent();
 32         }
 33         #region 数据模拟
 34         //随机数模拟通道数据
 35         public double getSendCount()
 36         {
 37             double iTotal = 0;
 38             //iTotal = rand.Next(100, 300) / 10.0;
 39             //iTotal = 50.0;
 40             iTotal = speed;
 41
 42             return iTotal;
 43         }
 44
 45         public double getChannel1()
 46         {
 47             double iTotal = 0;
 48             iTotal = rand.Next(100, 900) / 10.0;
 49
 50             return iTotal;
 51         }
 52
 53         public double getChannel2()
 54         {
 55             double iTotal = 0;
 56             iTotal = rand.Next(300, 800) / 10.0;
 57
 58             return iTotal;
 59         }
 60
 61         public double getChannel3()
 62         {
 63             double iTotal;
 64             iTotal = rand.Next(300, 700) / 10.0;
 65
 66             return iTotal;
 67         }
 68
 69         public double getChannel4()
 70         {
 71             double iTotal;
 72             iTotal = rand.Next(200, 600) / 10.0;
 73
 74             return iTotal;
 75         }
 76         #endregion
 77
 78         private void Form1_Load(object sender, EventArgs e)
 79         {
 80             // 创建画布坐标轴
 81             coordinate();
 82         }
 83
 84         #region 绘制坐标轴
 85         private void coordinate()
 86         {
 87             //定义model
 88             _myPlotModel = new PlotModel()
 89             {
 90                 Title = "速度检测",
 91                 //LegendTitle = "通道值",
 92                 LegendOrientation = LegendOrientation.Horizontal,
 93                 LegendPlacement = LegendPlacement.Outside,
 94                 LegendPosition = LegendPosition.TopCenter,
 95                 LegendBackground = OxyColor.FromAColor(0, OxyColors.Beige),
 96                 //设置文本框边框颜色
 97                 LegendBorder = OxyColors.Transparent
 98             };
 99
100
101
102             //X轴
103             _dateAxis = new DateTimeAxis()
104             {
105                 Position = AxisPosition.Bottom,
106                 Minimum = DateTimeAxis.ToDouble(DateTime.Now),
107                 Maximum = DateTimeAxis.ToDouble(DateTime.Now.AddMinutes(1)),
108                 MajorGridlineStyle = LineStyle.Solid,
109                 MinorGridlineStyle = LineStyle.Dot,
110                 IntervalLength = 80,
111                 Title = "time",//显示标题内容
112                 TitlePosition = 0.95,//显示标题位置
113                 IsZoomEnabled = true,
114                 IsPanEnabled = true
115             };
116             _myPlotModel.Axes.Add(_dateAxis);
117
118             //Y轴
119             _valueAxis = new LinearAxis()
120             {
121                 //Y轴刻度间距设置
122                 MajorStep = 10,
123                 Position = AxisPosition.Left,
124                 MajorGridlineStyle = LineStyle.Solid,
125                 MinorGridlineStyle = LineStyle.Dot,
126                 Title = "Speed",//显示标题内容
127                 TitlePosition = 1,//显示标题位置
128                 IntervalLength = 80,
129                 //设置坐标轴上的刻度标签的方向
130                 Angle = 0,
131                 IsZoomEnabled = false,
132                 IsPanEnabled = false,
133                 Maximum = 100,
134                 Minimum = 0
135             };
136             _myPlotModel.Axes.Add(_valueAxis);
137
138
139             //添加标注线,速度上下限
140             var lineTempMaxAnnotation = new OxyPlot.Annotations.LineAnnotation()
141             {
142                 Type = LineAnnotationType.Horizontal,
143                 Color = OxyColors.Red,
144                 LineStyle = LineStyle.Solid,
145                 Y = 10,
146                 Text = "Speed Min:10"
147
148             };
149             _myPlotModel.Annotations.Add(lineTempMaxAnnotation);
150
151             var lineTempMinAnnotation = new LineAnnotation()
152             {
153                 Type = LineAnnotationType.Horizontal,
154                 Y = 90,
155                 Text = "Speed Max:90",
156                 Color = OxyColors.Red,
157                 LineStyle = LineStyle.Solid
158             };
159             _myPlotModel.Annotations.Add(lineTempMinAnnotation);
160
161             //添加一条标准曲线,四个通道速度
162             var series = new LineSeries()
163             {
164                 Color = OxyColors.Green,
165                 //曲线的宽度设置
166                 StrokeThickness = 2,
167                 //标记大小的设置
168                 MarkerSize = 3,
169                 //标记的颜色设置
170                 MarkerStroke = OxyColors.DarkGreen,
171                 //标记的类型设置
172                 MarkerType = MarkerType.Diamond,
173                 Title = "standard",
174             };
175             _myPlotModel.Series.Add(series);
176
177             series = new LineSeries()
178             {
179                 Color = OxyColors.Blue,
180                 StrokeThickness = 2,
181                 MarkerSize = 3,
182                 MarkerStroke = OxyColors.BlueViolet,
183                 MarkerType = MarkerType.Star,
184                 Title = "channel1",
185             };
186             _myPlotModel.Series.Add(series);
187
188             series = new LineSeries()
189             {
190                 Color = OxyColors.Yellow,
191                 StrokeThickness = 2,
192                 MarkerSize = 3,
193                 MarkerStroke = OxyColors.Yellow,
194                 MarkerType = MarkerType.Star,
195                 Title = "channel2",
196             };
197             _myPlotModel.Series.Add(series);
198
199             series = new LineSeries()
200             {
201                 Color = OxyColors.SaddleBrown,
202                 StrokeThickness = 2,
203                 MarkerSize = 3,
204                 MarkerStroke = OxyColors.SaddleBrown,
205                 MarkerType = MarkerType.Star,
206                 Title = "channel3",
207             };
208             _myPlotModel.Series.Add(series);
209
210             series = new LineSeries()
211             {
212                 Color = OxyColors.HotPink,
213                 StrokeThickness = 2,
214                 MarkerSize = 3,
215                 MarkerStroke = OxyColors.HotPink,
216                 MarkerType = MarkerType.Star,
217                 Title = "channel4",
218             };
219             _myPlotModel.Series.Add(series);
220
221             plotView1.Model = _myPlotModel;
222
223         }
224         #endregion
225
226         #region 清除波形
227         private void clearDrawing()
228         {
229             //遍历,清除所有之前绘制的曲线
230             foreach (var lineSer in plotView1.Model.Series)
231             {
232                 ((LineSeries)lineSer).Points.Clear();
233             }
234             //清除完曲线之后,重新刷新坐标轴
235             _dateAxis.Minimum = DateTimeAxis.ToDouble(DateTime.Now.AddSeconds(0));
236             _dateAxis.Maximum = DateTimeAxis.ToDouble(DateTime.Now.AddSeconds(1));
237             _myPlotModel.InvalidatePlot(true);
238             Thread.Sleep(10);
239         }
240         #endregion
241
242         #region 曲线绘制
243         //数据曲线绘制
244         private void drawing()
245         {
246             //开启绘图时刷新坐标轴时间
247             _dateAxis.Minimum = DateTimeAxis.ToDouble(DateTime.Now);
248             _dateAxis.Maximum = DateTimeAxis.ToDouble(DateTime.Now.AddMinutes(1));
249
250             bool bToMove = false;
251
252             Task.Factory.StartNew(() =>
253             {
254                 while (flag)
255                 {
256
257                     var date = DateTime.Now;
258                     _myPlotModel.Axes[0].Maximum = DateTimeAxis.ToDouble(date.AddSeconds(1));
259
260                     var lineSer = plotView1.Model.Series[0] as LineSeries;
261                     lineSer.Points.Add(new DataPoint(DateTimeAxis.ToDouble(date), getSendCount()));
262                     if (lineSer.Points.Count > 200)
263                     {
264                         lineSer.Points.RemoveAt(0);
265                     }
266                     plotView1.Model.Series[0].Title = string.Format("standard : {0:00.00}km/h", getSendCount());
267
268                     lineSer = plotView1.Model.Series[1] as LineSeries;
269                     lineSer.Points.Add(new DataPoint(DateTimeAxis.ToDouble(date), getChannel1()));
270                     if (lineSer.Points.Count > 200)
271                     {
272                         lineSer.Points.RemoveAt(0);
273                     }
274                     //Current channel speed refreshes
275                     plotView1.Model.Series[1].Title = string.Format("channel1 : {0:00.00}km/h", getChannel1());
276
277                     lineSer = plotView1.Model.Series[2] as LineSeries;
278                     lineSer.Points.Add(new DataPoint(DateTimeAxis.ToDouble(date), getChannel2()));
279                     if (lineSer.Points.Count > 200)
280                     {
281                         lineSer.Points.RemoveAt(0);
282                     }
283                     plotView1.Model.Series[2].Title = string.Format("channel2 : {0:00.00}km/h", getChannel2());
284
285                     lineSer = plotView1.Model.Series[3] as LineSeries;
286                     lineSer.Points.Add(new DataPoint(DateTimeAxis.ToDouble(date), getChannel3()));
287                     if (lineSer.Points.Count > 200)
288                     {
289                         lineSer.Points.RemoveAt(0);
290                     }
291                     plotView1.Model.Series[3].Title = string.Format("channel3 : {0:00.00}km/h", getChannel3());
292
293                     lineSer = plotView1.Model.Series[4] as LineSeries;
294                     lineSer.Points.Add(new DataPoint(DateTimeAxis.ToDouble(date), getChannel4()));
295                     if (lineSer.Points.Count > 200)
296                     {
297                         lineSer.Points.RemoveAt(0);
298                     }
299                     plotView1.Model.Series[4].Title = string.Format("channel4 : {0:00.00}km/h", getChannel4());
300
301
302
303                     if (!bToMove)
304                     {
305                         TimeSpan timeSpan = DateTime.Now - DateTimeAxis.ToDateTime(_dateAxis.Minimum);
306                         if (timeSpan.TotalSeconds >= 58)
307                         {
308                             bToMove = true;
309                         }
310                     }
311                     else
312                     {
313                         _dateAxis.Minimum = DateTimeAxis.ToDouble(DateTime.Now.AddSeconds(-58));
314                         _dateAxis.Maximum = DateTimeAxis.ToDouble(DateTime.Now.AddSeconds(2));
315                     }
316
317
318                     _myPlotModel.InvalidatePlot(true);
319                     Thread.Sleep(1000);
320                 }
321             });
322         }
323         #endregion
324
325         private void plotView1_Click(object sender, EventArgs e)
326         {
327
328         }
329
330         //滑轨控件拖拉事件
331         private void trackBar1_Scroll(object sender, EventArgs e)
332         {
333             speed = trackBar1.Value;
334         }
335
336         //start/stop按键单击事件
337         private void Start_Click(object sender, EventArgs e)
338         {
339             if (flag == false)
340             {
341                 Start.Text = "stop";
342                 flag = true;
343                 //开启绘图线程
344                 drawing();
345             }
346             else
347             {
348                 Start.Text = "start";
349                 flag = false;
350             }
351         }
352
353         //波形清除按键单击事件
354         private void clearButton_Click(object sender, EventArgs e)
355         {
356             Start.Enabled = false;
357             clearDrawing();
358             Thread.Sleep(10);
359             flag = false;
360             Thread.Sleep(1100);
361             flag = true;
362             drawing();
363             Start.Enabled = true;
364         }
365
366     }
367 }
View Code
工程代码的基本设计框架如下图所示:
使用过GDI+绘图的朋友都知道,在进行图像绘制之前都需要先创建一块画布,对一些基本的界面元素需要先完成布局。使用OxyOplot控件也一样,绘制曲线需要在坐标轴里面进行绘制,那么我们就需要先将该部分坐标轴中的坐标轴标题、X/Y轴、刻度值、四个曲线通道等等进行绘制,该部分的设计代码如下:
  1 #region 绘制坐标轴
  2         private void coordinate()
  3         {
  4             //定义model
  5             _myPlotModel = new PlotModel()
  6             {
  7                 Title = "速度检测",
  8                 //LegendTitle = "通道值",
  9                 LegendOrientation = LegendOrientation.Horizontal,
 10                 LegendPlacement = LegendPlacement.Outside,
 11                 LegendPosition = LegendPosition.TopCenter,
 12                 LegendBackground = OxyColor.FromAColor(0, OxyColors.Beige),
 13                 //设置文本框边框颜色
 14                 LegendBorder = OxyColors.Transparent
 15             };
 16
 17
 18
 19             //X轴
 20             _dateAxis = new DateTimeAxis()
 21             {
 22                 Position = AxisPosition.Bottom,
 23                 Minimum = DateTimeAxis.ToDouble(DateTime.Now),
 24                 Maximum = DateTimeAxis.ToDouble(DateTime.Now.AddMinutes(1)),
 25                 MajorGridlineStyle = LineStyle.Solid,
 26                 MinorGridlineStyle = LineStyle.Dot,
 27                 IntervalLength = 80,
 28                 Title = "time",//显示标题内容
 29                 TitlePosition = 0.95,//显示标题位置
 30                 IsZoomEnabled = true,
 31                 IsPanEnabled = true
 32             };
 33             _myPlotModel.Axes.Add(_dateAxis);
 34
 35             //Y轴
 36             _valueAxis = new LinearAxis()
 37             {
 38                 //Y轴刻度间距设置
 39                 MajorStep = 10,
 40                 Position = AxisPosition.Left,
 41                 MajorGridlineStyle = LineStyle.Solid,
 42                 MinorGridlineStyle = LineStyle.Dot,
 43                 Title = "Speed",//显示标题内容
 44                 TitlePosition = 1,//显示标题位置
 45                 IntervalLength = 80,
 46                 //设置坐标轴上的刻度标签的方向
 47                 Angle = 0,
 48                 IsZoomEnabled = false,
 49                 IsPanEnabled = false,
 50                 Maximum = 100,
 51                 Minimum = 0
 52             };
 53             _myPlotModel.Axes.Add(_valueAxis);
 54
 55
 56             //添加标注线,速度上下限
 57             var lineTempMaxAnnotation = new OxyPlot.Annotations.LineAnnotation()
 58             {
 59                 Type = LineAnnotationType.Horizontal,
 60                 Color = OxyColors.Red,
 61                 LineStyle = LineStyle.Solid,
 62                 Y = 10,
 63                 Text = "Speed Min:10"
 64
 65             };
 66             _myPlotModel.Annotations.Add(lineTempMaxAnnotation);
 67
 68             var lineTempMinAnnotation = new LineAnnotation()
 69             {
 70                 Type = LineAnnotationType.Horizontal,
 71                 Y = 90,
 72                 Text = "Speed Max:90",
 73                 Color = OxyColors.Red,
 74                 LineStyle = LineStyle.Solid
 75             };
 76             _myPlotModel.Annotations.Add(lineTempMinAnnotation);
 77
 78             //添加一条标准曲线,四个通道速度
 79             var series = new LineSeries()
 80             {
 81                 Color = OxyColors.Green,
 82                 //曲线的宽度设置
 83                 StrokeThickness = 2,
 84                 //标记大小的设置
 85                 MarkerSize = 3,
 86                 //标记的颜色设置
 87                 MarkerStroke = OxyColors.DarkGreen,
 88                 //标记的类型设置
 89                 MarkerType = MarkerType.Diamond,
 90                 Title = "standard",
 91             };
 92             _myPlotModel.Series.Add(series);
 93
 94             series = new LineSeries()
 95             {
 96                 Color = OxyColors.Blue,
 97                 StrokeThickness = 2,
 98                 MarkerSize = 3,
 99                 MarkerStroke = OxyColors.BlueViolet,
100                 MarkerType = MarkerType.Star,
101                 Title = "channel1",
102             };
103             _myPlotModel.Series.Add(series);
104
105             series = new LineSeries()
106             {
107                 Color = OxyColors.Yellow,
108                 StrokeThickness = 2,
109                 MarkerSize = 3,
110                 MarkerStroke = OxyColors.Yellow,
111                 MarkerType = MarkerType.Star,
112                 Title = "channel2",
113             };
114             _myPlotModel.Series.Add(series);
115
116             series = new LineSeries()
117             {
118                 Color = OxyColors.SaddleBrown,
119                 StrokeThickness = 2,
120                 MarkerSize = 3,
121                 MarkerStroke = OxyColors.SaddleBrown,
122                 MarkerType = MarkerType.Star,
123                 Title = "channel3",
124             };
125             _myPlotModel.Series.Add(series);
126
127             series = new LineSeries()
128             {
129                 Color = OxyColors.HotPink,
130                 StrokeThickness = 2,
131                 MarkerSize = 3,
132                 MarkerStroke = OxyColors.HotPink,
133                 MarkerType = MarkerType.Star,
134                 Title = "channel4",
135             };
136             _myPlotModel.Series.Add(series);
137
138             plotView1.Model = _myPlotModel;
139
140         }
141         #endregion
绘制曲线需要外部提供数据,在这里为了方便显示效果,使用了Random()随机数方法生成了三组数据,另外一组数据通过和滑杆控件相关联,总共完成四组通道数据的模拟。
#region 数据模拟
        //随机数模拟通道数据
        public double getSendCount()
        {
            double iTotal = 0;
            //iTotal = rand.Next(100, 300) / 10.0;
            //iTotal = 50.0;
            iTotal = speed;

            return iTotal;
        }

        public double getChannel1()
        {
            double iTotal = 0;
            iTotal = rand.Next(100, 900) / 10.0;

            return iTotal;
        }

        public double getChannel2()
        {
            double iTotal = 0;
            iTotal = rand.Next(300, 800) / 10.0;

            return iTotal;
        }

        public double getChannel3()
        {
            double iTotal;
            iTotal = rand.Next(300, 700) / 10.0;

            return iTotal;
        }

        public double getChannel4()
        {
            double iTotal;
            iTotal = rand.Next(200, 600) / 10.0;

            return iTotal;
        }
        #endregion

//滑轨控件拖拉事件
        private void trackBar1_Scroll(object sender, EventArgs e)
        {
            speed = trackBar1.Value;
        }
绘制曲线的时候,为了不引起和主线程的冲突,因此单独创建了一个独立的子线程完成绘图的操作,当界面中积累的曲线点数达到60个点时,坐标轴就会往左边平移,曲线绘制函数设计如下:
 1 #region 曲线绘制
 2         //数据曲线绘制
 3         private void drawing()
 4         {
 5             //开启绘图时刷新坐标轴时间
 6             _dateAxis.Minimum = DateTimeAxis.ToDouble(DateTime.Now);
 7             _dateAxis.Maximum = DateTimeAxis.ToDouble(DateTime.Now.AddMinutes(1));
 8
 9             bool bToMove = false;
10
11             Task.Factory.StartNew(() =>
12             {
13                 while (flag)
14                 {
15
16                     var date = DateTime.Now;
17                     _myPlotModel.Axes[0].Maximum = DateTimeAxis.ToDouble(date.AddSeconds(1));
18
19                     var lineSer = plotView1.Model.Series[0] as LineSeries;
20                     lineSer.Points.Add(new DataPoint(DateTimeAxis.ToDouble(date), getSendCount()));
21                     if (lineSer.Points.Count > 200)
22                     {
23                         lineSer.Points.RemoveAt(0);
24                     }
25                     plotView1.Model.Series[0].Title = string.Format("standard : {0:00.00}km/h", getSendCount());
26
27                     lineSer = plotView1.Model.Series[1] as LineSeries;
28                     lineSer.Points.Add(new DataPoint(DateTimeAxis.ToDouble(date), getChannel1()));
29                     if (lineSer.Points.Count > 200)
30                     {
31                         lineSer.Points.RemoveAt(0);
32                     }
33                     //Current channel speed refreshes
34                     plotView1.Model.Series[1].Title = string.Format("channel1 : {0:00.00}km/h", getChannel1());
35
36                     lineSer = plotView1.Model.Series[2] as LineSeries;
37                     lineSer.Points.Add(new DataPoint(DateTimeAxis.ToDouble(date), getChannel2()));
38                     if (lineSer.Points.Count > 200)
39                     {
40                         lineSer.Points.RemoveAt(0);
41                     }
42                     plotView1.Model.Series[2].Title = string.Format("channel2 : {0:00.00}km/h", getChannel2());
43
44                     lineSer = plotView1.Model.Series[3] as LineSeries;
45                     lineSer.Points.Add(new DataPoint(DateTimeAxis.ToDouble(date), getChannel3()));
46                     if (lineSer.Points.Count > 200)
47                     {
48                         lineSer.Points.RemoveAt(0);
49                     }
50                     plotView1.Model.Series[3].Title = string.Format("channel3 : {0:00.00}km/h", getChannel3());
51
52                     lineSer = plotView1.Model.Series[4] as LineSeries;
53                     lineSer.Points.Add(new DataPoint(DateTimeAxis.ToDouble(date), getChannel4()));
54                     if (lineSer.Points.Count > 200)
55                     {
56                         lineSer.Points.RemoveAt(0);
57                     }
58                     plotView1.Model.Series[4].Title = string.Format("channel4 : {0:00.00}km/h", getChannel4());
59
60
61
62                     if (!bToMove)
63                     {
64                         TimeSpan timeSpan = DateTime.Now - DateTimeAxis.ToDateTime(_dateAxis.Minimum);
65                         if (timeSpan.TotalSeconds >= 58)
66                         {
67                             bToMove = true;
68                         }
69                     }
70                     else
71                     {
72                         _dateAxis.Minimum = DateTimeAxis.ToDouble(DateTime.Now.AddSeconds(-58));
73                         _dateAxis.Maximum = DateTimeAxis.ToDouble(DateTime.Now.AddSeconds(2));
74                     }
75
76
77                     _myPlotModel.InvalidatePlot(true);
78                     Thread.Sleep(1000);
79                 }
80             });
81         }
82         #endregion
开始绘制曲线和和停止整合成一个按键,实现原理如下:
 1 //start/stop按键单击事件
 2         private void Start_Click(object sender, EventArgs e)
 3         {
 4             if (flag == false)
 5             {
 6                 Start.Text = "stop";
 7                 flag = true;
 8                 //开启绘图线程
 9                 drawing();
10             }
11             else
12             {
13                 Start.Text = "start";
14                 flag = false;
15             }
16         }
在实际的监控界面中,为了满足清除界面的曲线的需求,增加了清除显示曲线的工程,防止出现线程冲突和线程多开,需要先失能开始的按键,因为绘制曲线是没1000ms绘制一次,所以线程在完成一次关闭和开启的时候需要添加一个大于1000ms的延时,界面清除完毕之后再使能开始按钮,设计原理如下:
 1 //波形清除按键单击事件
 2         private void clearButton_Click(object sender, EventArgs e)
 3         {
 4             Start.Enabled = false;
 5             clearDrawing();
 6             Thread.Sleep(10);
 7             flag = false;
 8             Thread.Sleep(1100);
 9             flag = true;
10             drawing();
11             Start.Enabled = true;
12         }
13
14 #region 清除波形
15         private void clearDrawing()
16         {
17             //遍历,清除所有之前绘制的曲线
18             foreach (var lineSer in plotView1.Model.Series)
19             {
20                 ((LineSeries)lineSer).Points.Clear();
21             }
22             //清除完曲线之后,重新刷新坐标轴
23             _dateAxis.Minimum = DateTimeAxis.ToDouble(DateTime.Now.AddSeconds(0));
24             _dateAxis.Maximum = DateTimeAxis.ToDouble(DateTime.Now.AddSeconds(1));
25             _myPlotModel.InvalidatePlot(true);
26             Thread.Sleep(10);
27         }
28         #endregion
最终效果图如下:
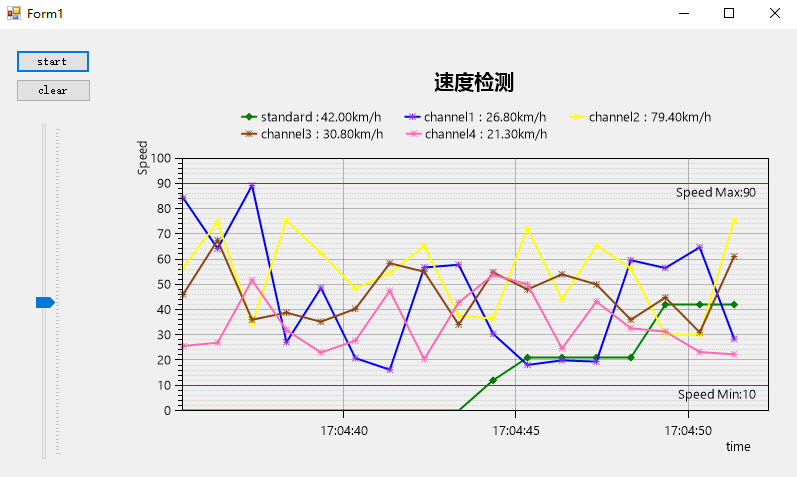
OxyPlot组件自带一些工程,在图像显示区域可以滚动鼠标的滚轮对曲线进行缩小放大,通过双击鼠标滚轮可以恢复正常曲线显示。
如有各位大佬们有更好的完善建议和想法,欢迎在留言区一起讨论,一起学习一起进步!
需要完整工程朋友,可以通过以下链接下载:
链接:https://pan.baidu.com/s/1Vu1hFEO03_gx5yeCDbgDGA
提取码:r8na